“PwC's Virtual Case Experience is an interactive online platform that offers students virtual work experience. Through this platform students can work on simulated client projects from anywhere at anytime. They receive instructions from real PwC staff, enabling them to master virtual client cases and gain firsthand experience of our work and how we assist our clients"
The Power BI Virtual Case focuses on three business scenarios centered around the fictional telecom company PhoneNow. The management team requires an overview of customer and agent trends, insights into how to improve customer retention and an understanding of diversity and inclusion to improve gender balance within the company.
"The call centre manager at PhoneNow is looking for transparency and insights into the data they have collected. They are after an accurate overview of long-term trends in customer and agent behaviour... You will need to create a dashboard for the trends that can be used as a basis for discussion with higher management."
Let’s jump in and check out the first data set as we turn PhoneNow's raw data into visually immersive and interactive insights.
To get the data ready for analysis we are going to use PostgreSQL. We can create a table with the relevant columns and import our data.
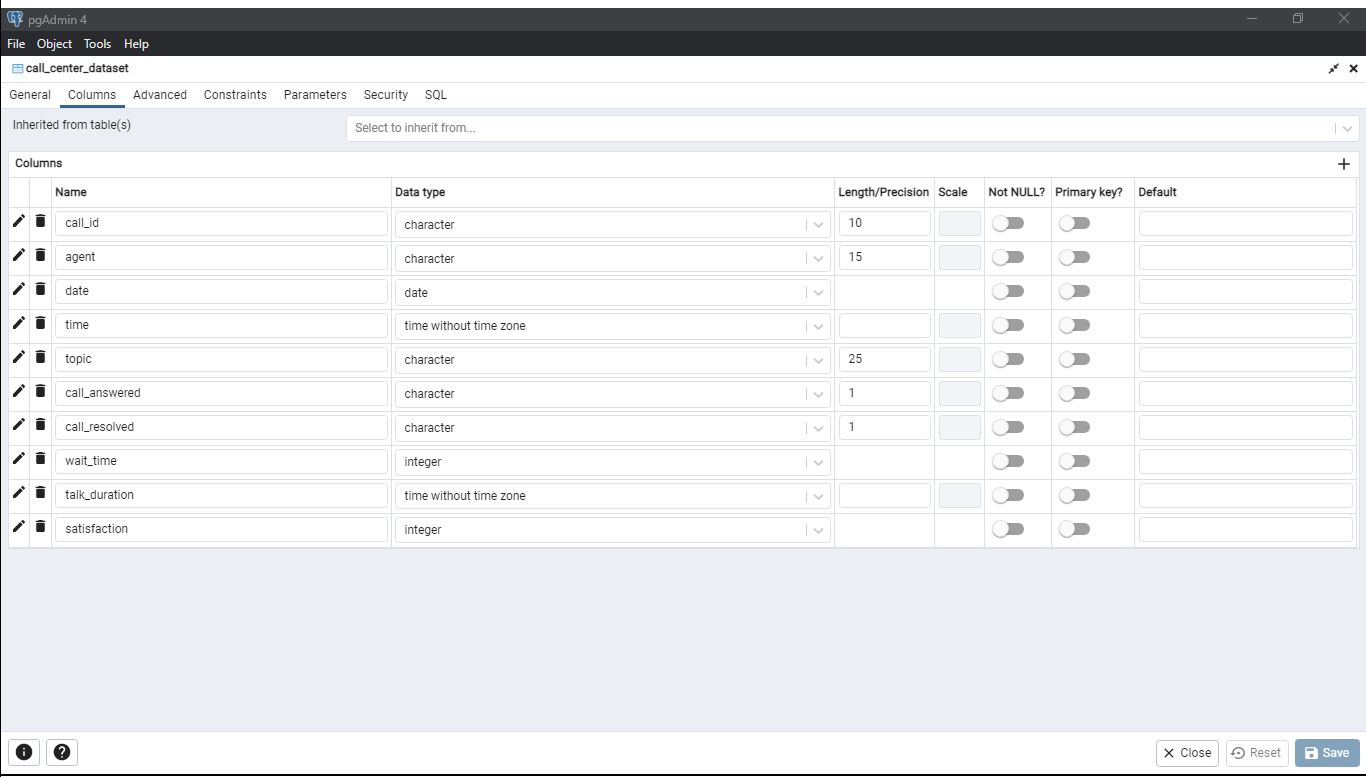
This data set contains 10 columns and 5000 rows of data covering 3 months of incoming calls.
Before we get to writing out our main query to extract data for our dashboard, let's check if we have any duplicates that we need to deal with.
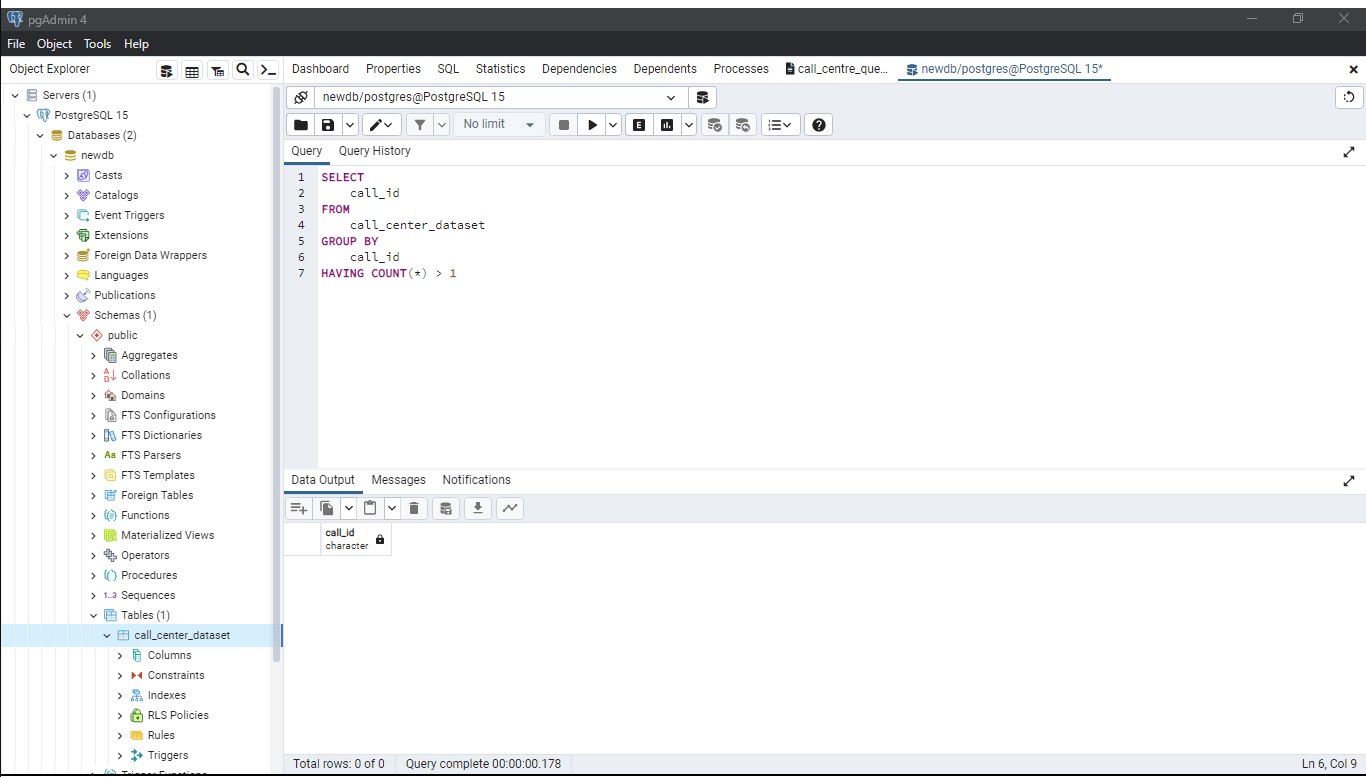
Looks like we are all good. Let's go through our main query.
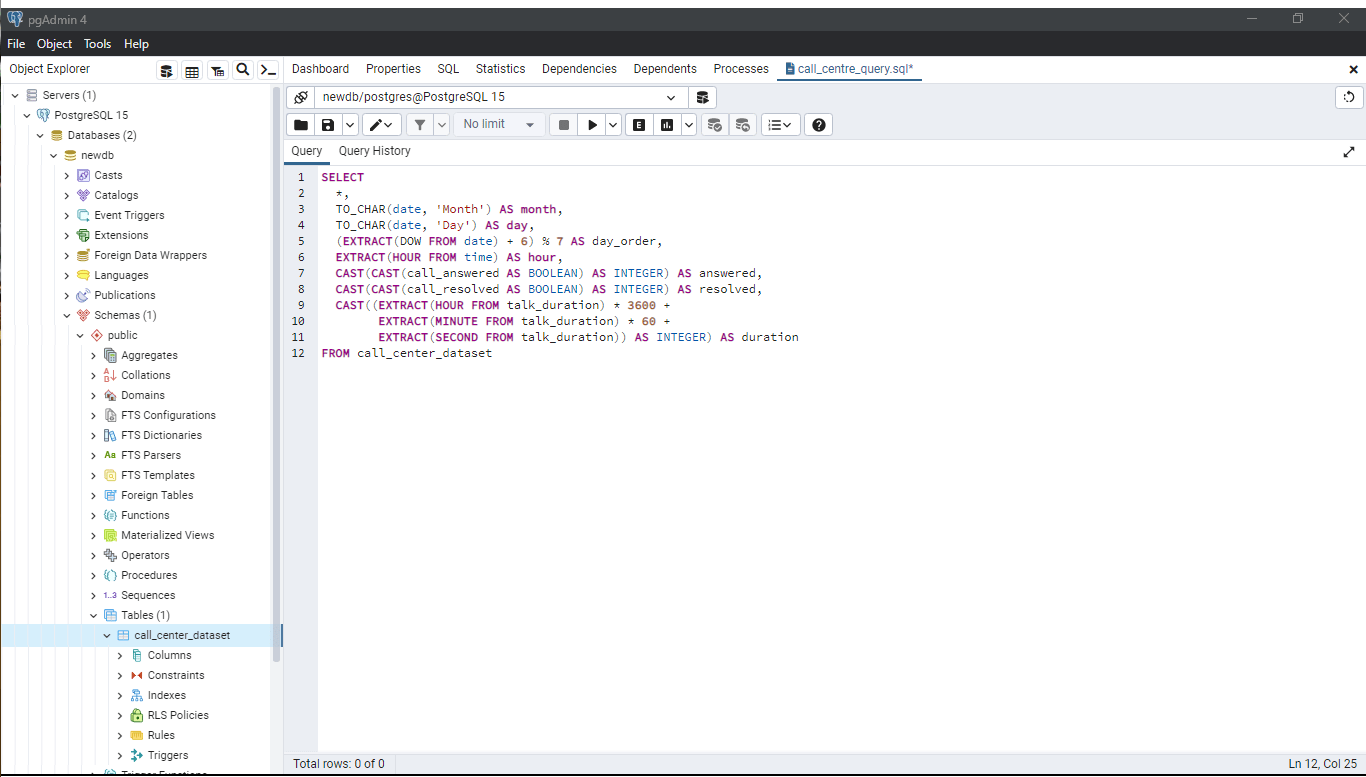
We are going to select all of our existing columns as well as creating some new ones: we can get the month, day, day of the week and the hour of each call. Additionally, we can create an integer version of whether the call was answered or not and whether it was resolved. This will be useful for calculations in the future. Finally we need to clean up our duration column by converting it from a duration into seconds.
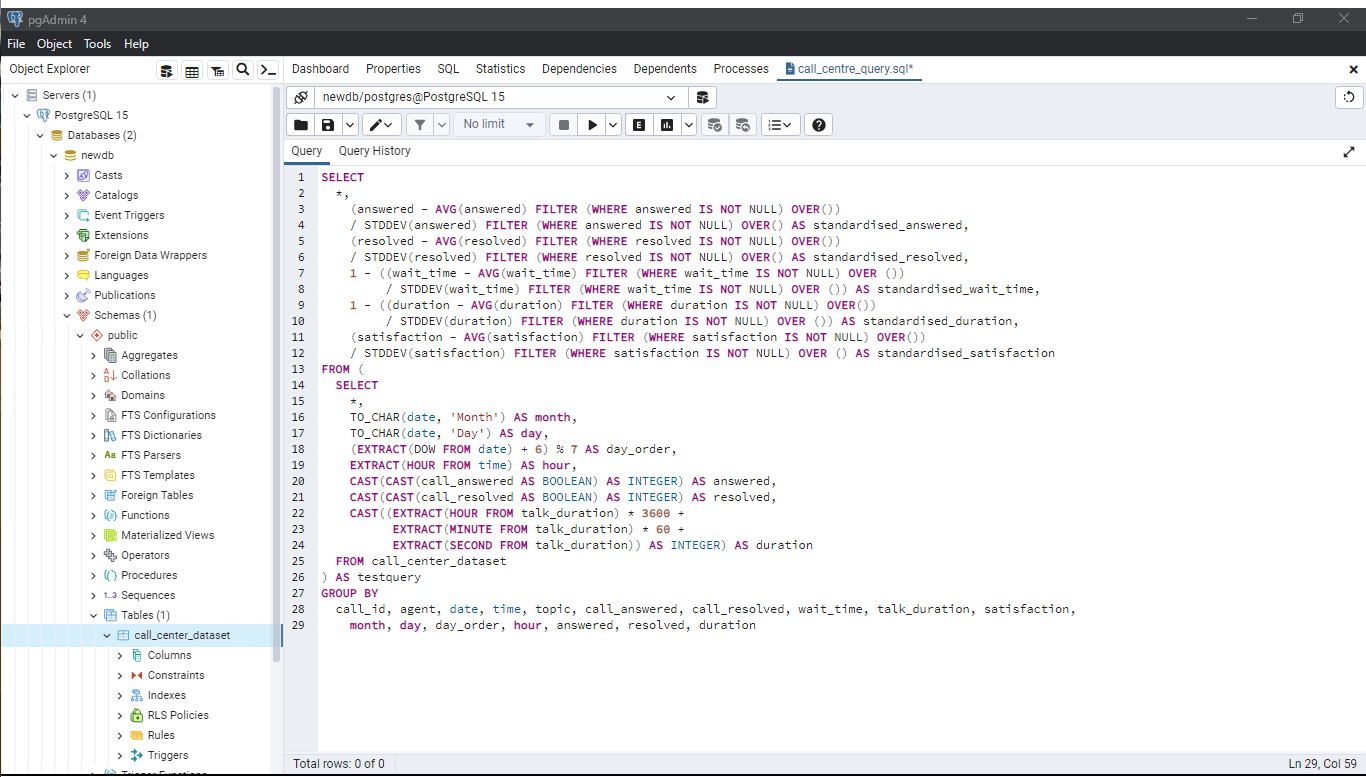
Along with all these variables we can also create an agent performance metric to evaluate the success of each call. We can do this by standardising five factors that contribute to the success of a call: if the call was answered, if it was resolved, the time the customer had to wait, the duration of the call and the customer satisfaction.
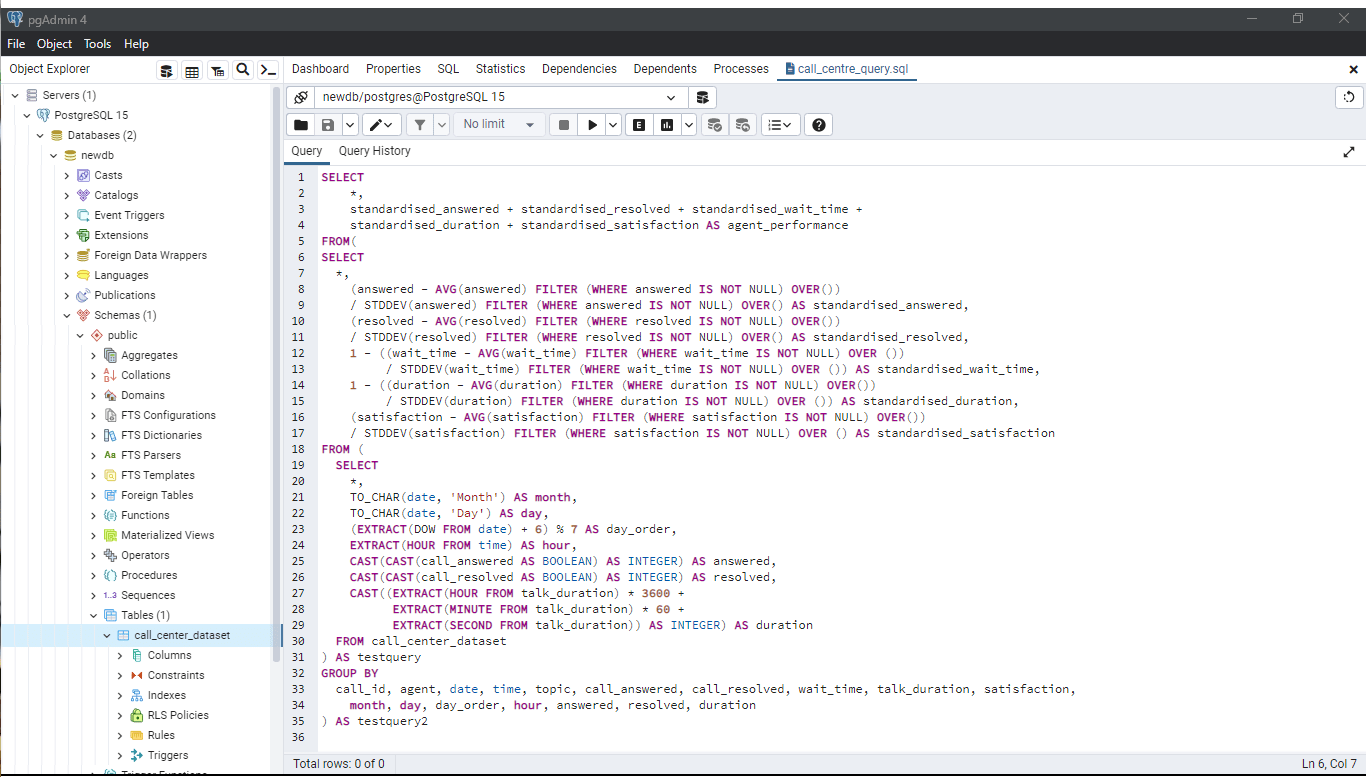
We can then add up all of these variables to create our agent performance metric.
Now that we have our data ready to go we can jump into Power BI.

The first KPI we can visualise is the number of calls per day. As opposed to displaying this metric as the total calls received, we can calculate the average calls per day to make it easier to digest. PhoneNow receive 56 calls per day.
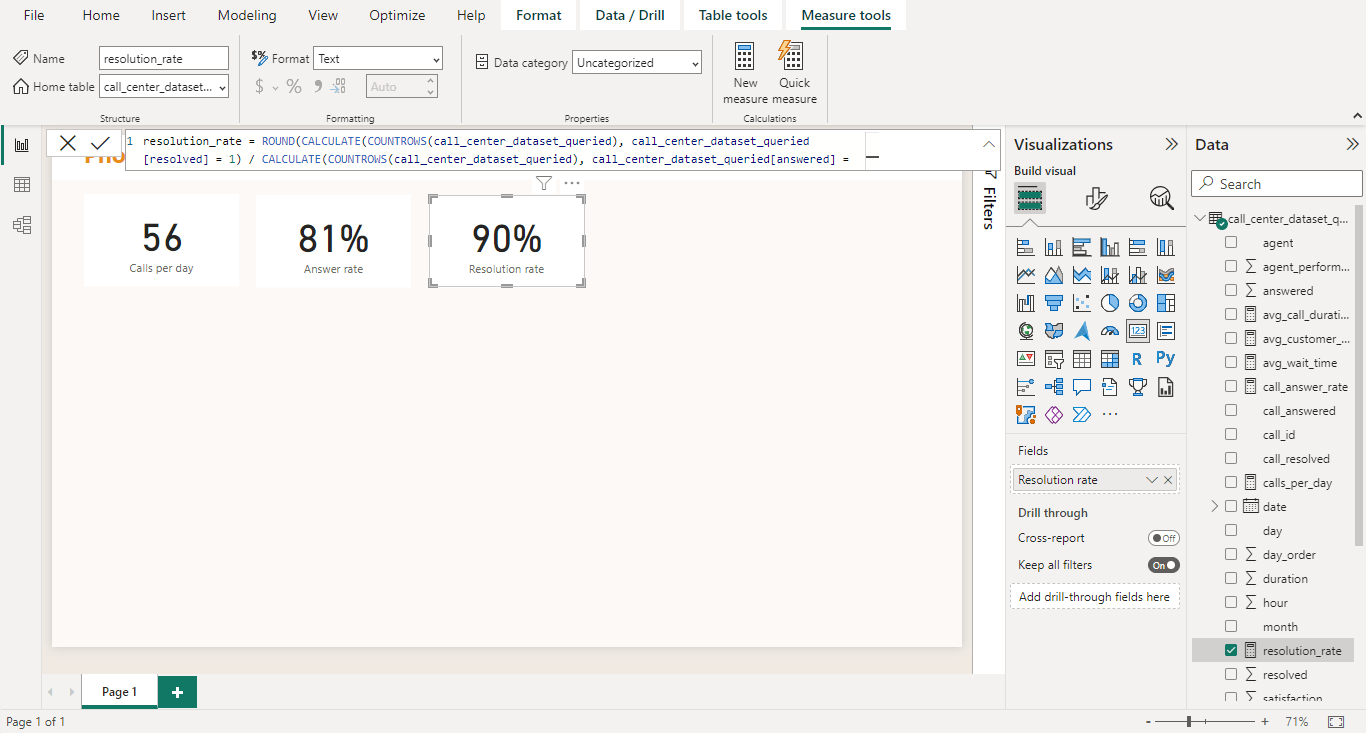
Next we can calculate the answer and resolution rate of these calls: 81% of incoming get picked up by PhoneNow agents of which 90% are resolved.
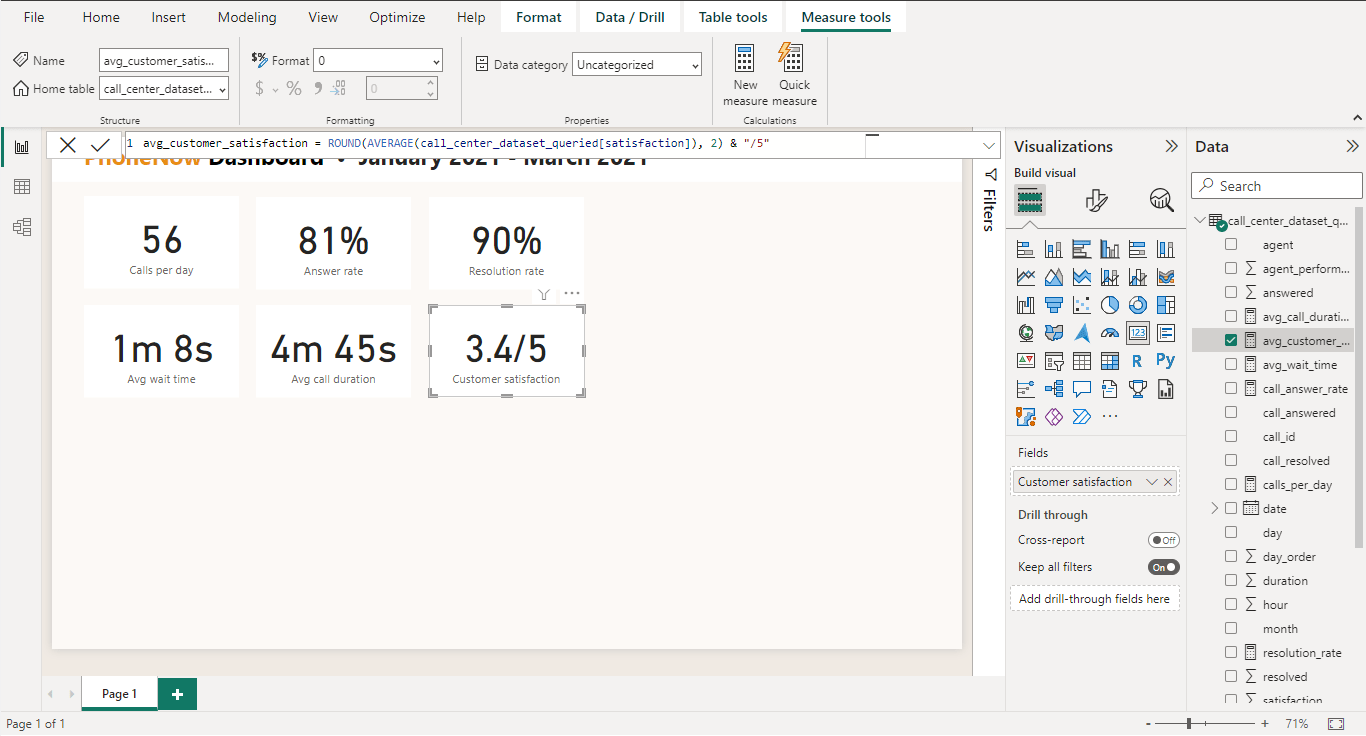
The average wait duration sits at just over 1 minute and the average call time close to 5 minutes. The average customer satisfaction of a call is 3.4 out of five.
So with a helicopter view of PhoneNow's operations lets add some variables to dive deeper into these metrics.
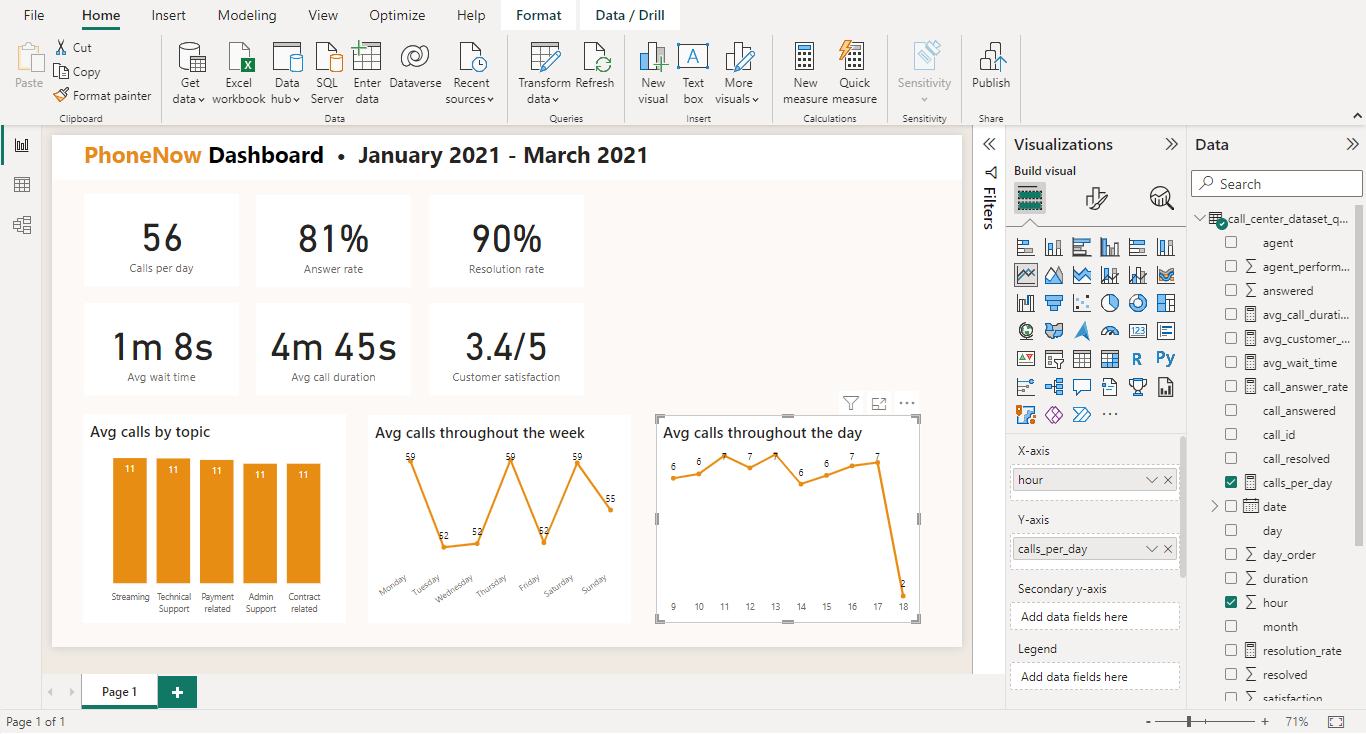
The topic of incoming calls are very even across the board, so too the average calls arcoss different days of the week and the average calls throughout the day.
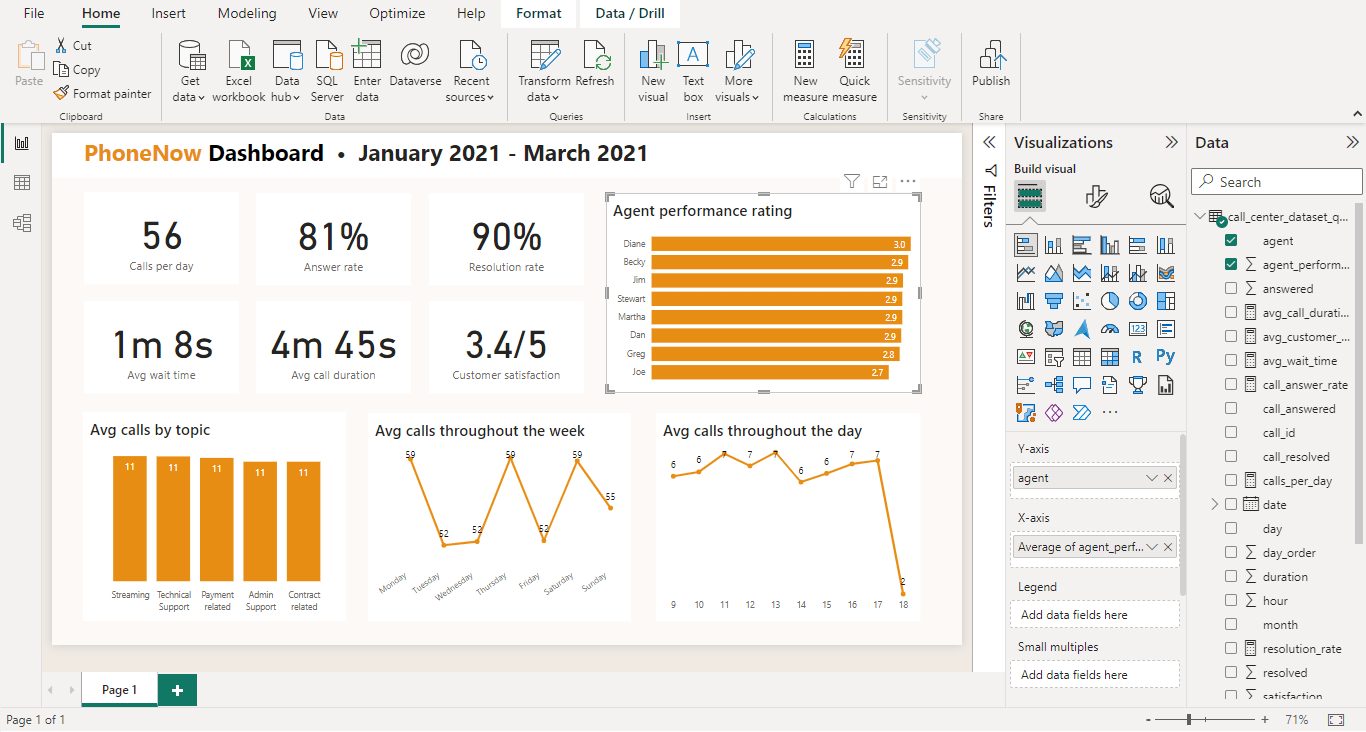
Finally, we can add the average performance rating of our agents.
Of course one of the biggest advantages of building a dashboard is it's interactivity. PhoneNow's call centre manager can explore key metrics to gain a deeper understanding of their company.
"Customers in the telecom industry are hard-earned and we don't want to lose them. Currently, the retention department gets in touch with customers after they have terminated their contract, but this is reactionary. It would better to know which customers are at risk. We have done customer analysis with Excel but it has always ended in a dead-end. We would like to know more about our customers, visualised clearly so that it's self-explanatory for our management."
We can take a similar approach as the first project by loading our data into postgresql, extracting the data and visualising it in Power BI.
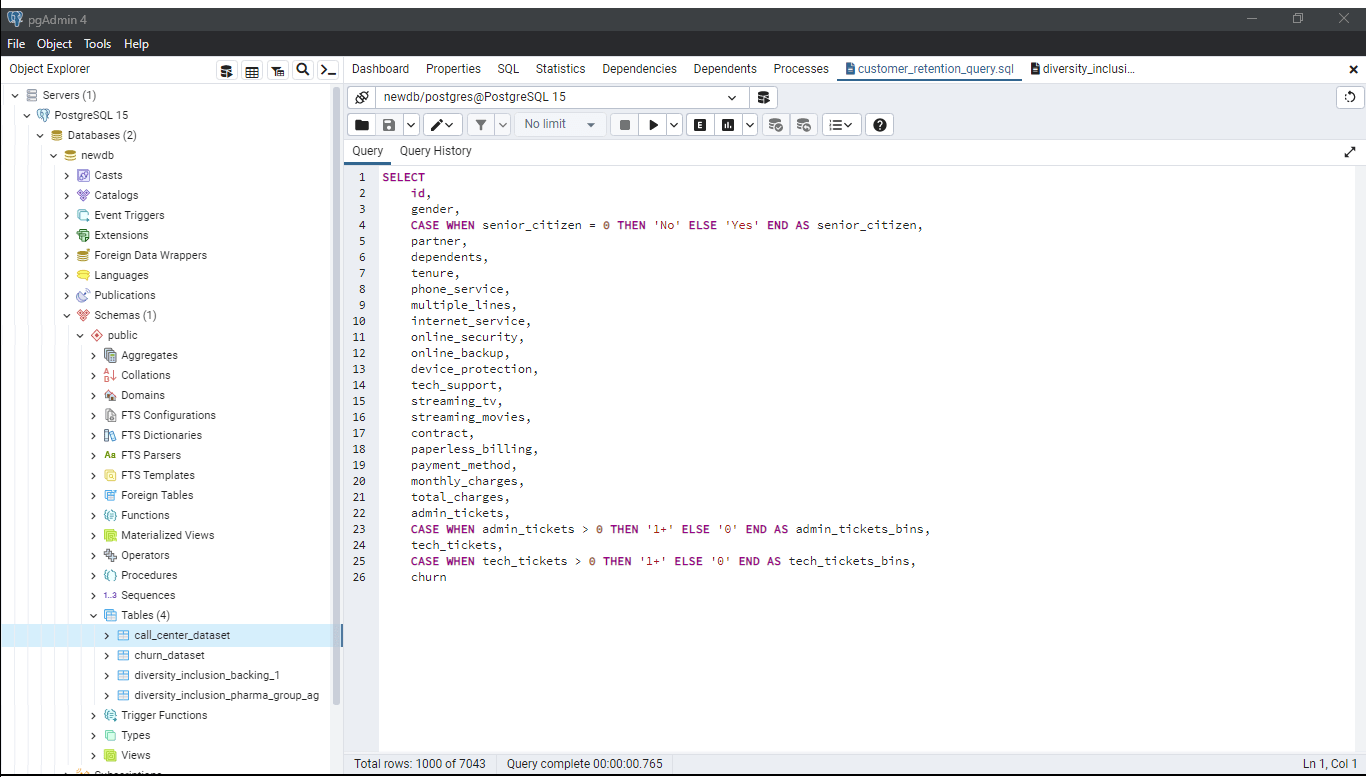
We can select the desired existing columns from our new data set and create two new columns that summarise the number of admin and tech tickets opened.
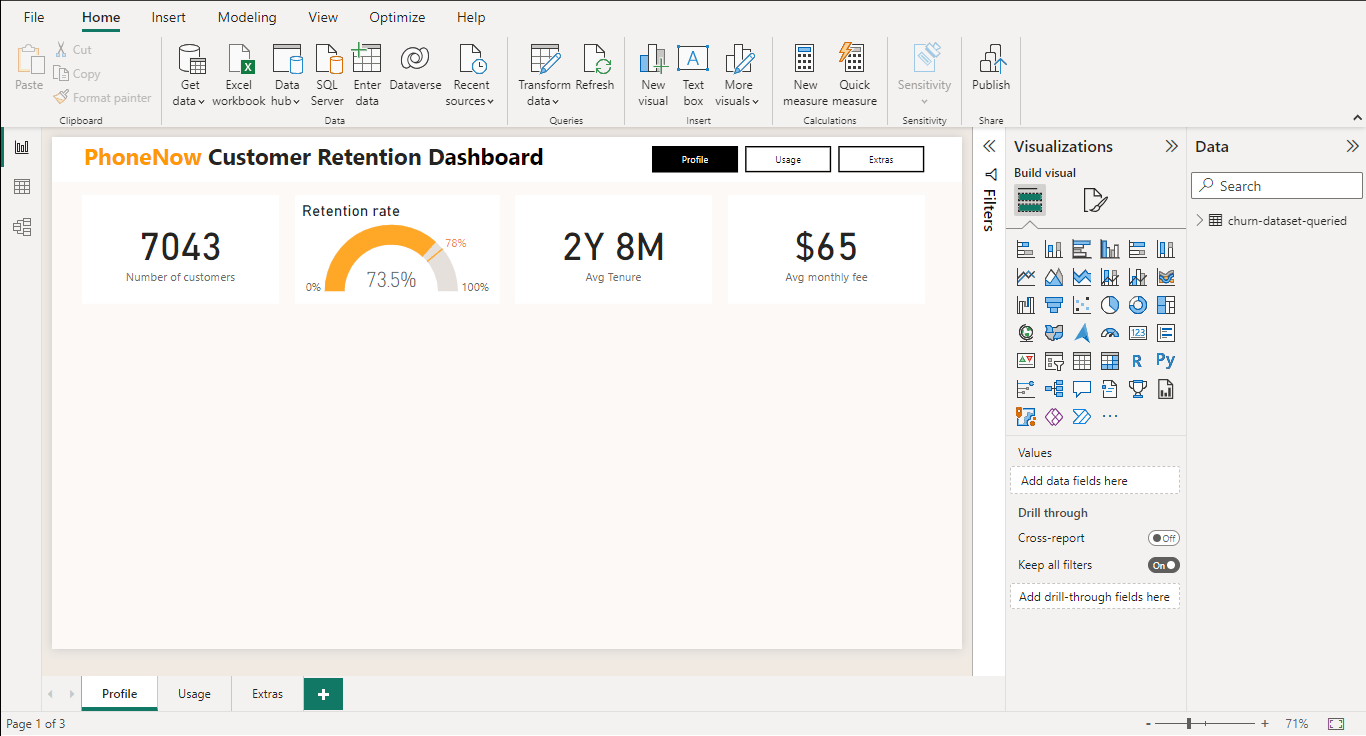
At the top of our dashboard we have our KPIs: The number of PhoneNow customers in the data set, the current retention rate, the average customer tenure and the average monthly fee.
The telecom industry standard retention rate is 78%. This seems like a great goal for PhoneNow's retention department. Let's explore some key variables to drill down on where they could make some improvements.
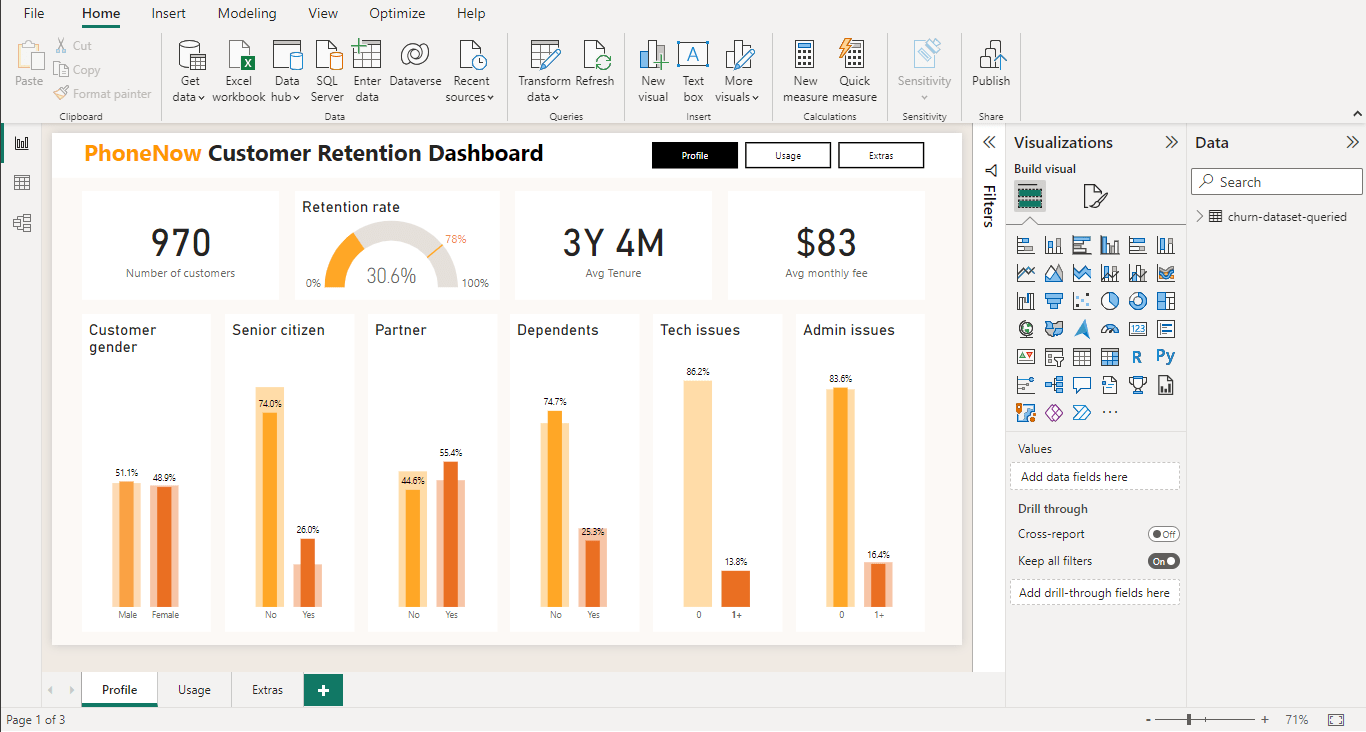
Of the 13.8% of customers that open a ticket for a tech issue just 30.6% stay on with the company. These customers are important too, averaging higher tenure and monthly spend than the average customer. Improving the ability to deal with these tech issues could keep hundreds of valuable customers with the company.
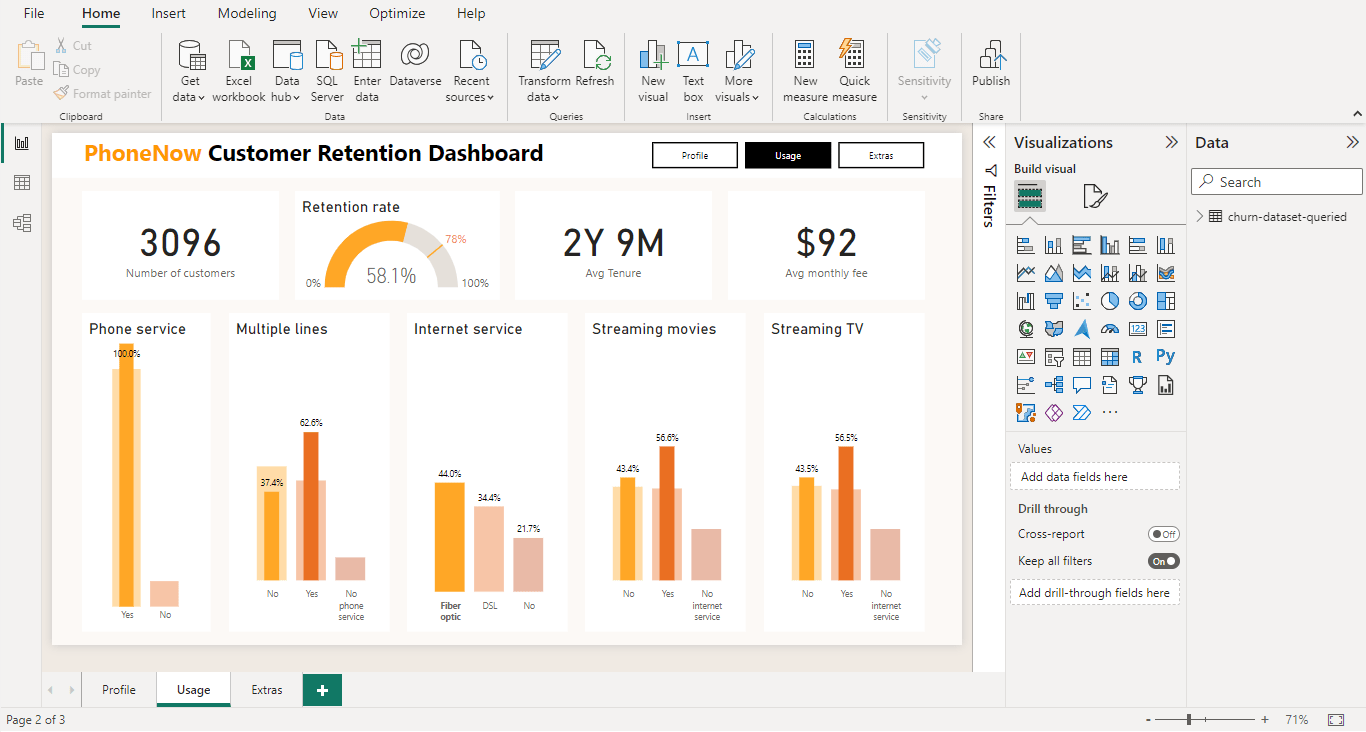
We can also see a decrease in the retention rate of customers who have fiber optic internet. While this issue needs more investigating to identify the exact problem, it could be key to improving customer experience and ultimately retention given the large amount of customers.
PhoneNow's customer retention department can now explore the impact of variety of variables on the KPI retention rate through this interactive dashboard. Through an initial exploration it is recommended that PhoneNow improve their ability to deal with teach issues to try to improve their retention rate to the industry standard. Further investigation is also recommended into fiber optic connections given the correlation with a drop in retention rate.
"Finally HR believes that diversity and inclusion are important part of the work place. They have been working hard to improve gender balance at the executive management level, but they're not seeing any progress. You will need to define key performance indicators related to hiring, promotion, performance and turnover and create a dashboard for HR to use."
So for our last business task let's see if we can discover any insights into gender balance within the company.
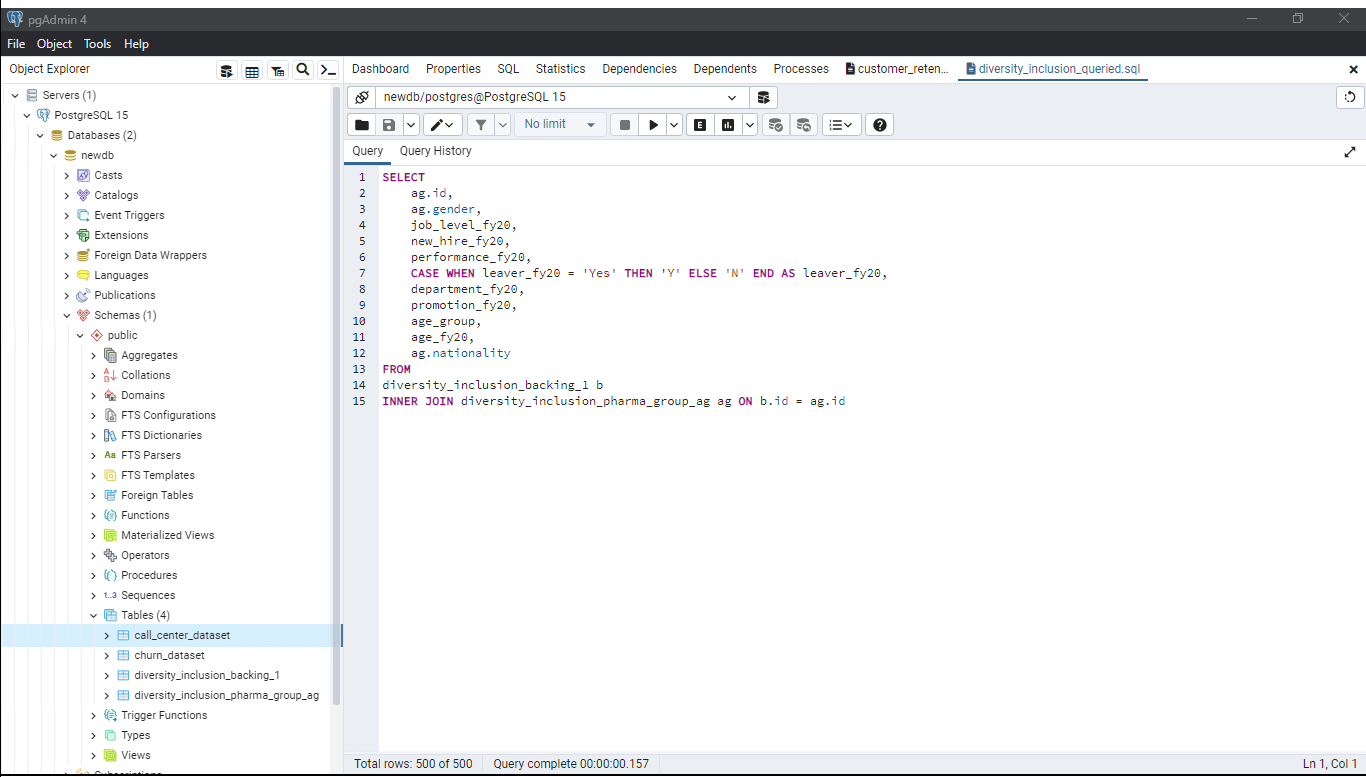
While there are a lot of variable we are going to focus on the 2020 financial year data. We can pull gender, our primary variable, as well as additional information about each staff member.
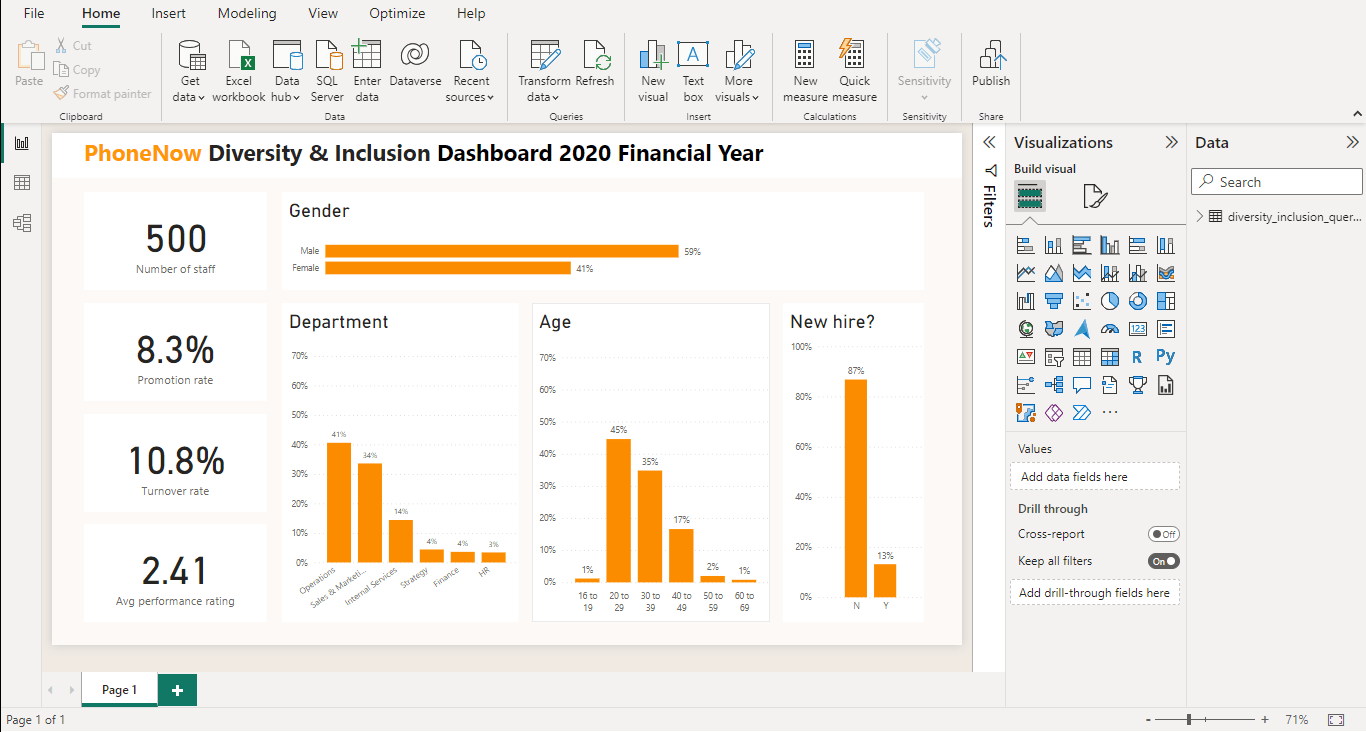
This data set includes 500 members of staff. Let's see how our KPIs change by gender.
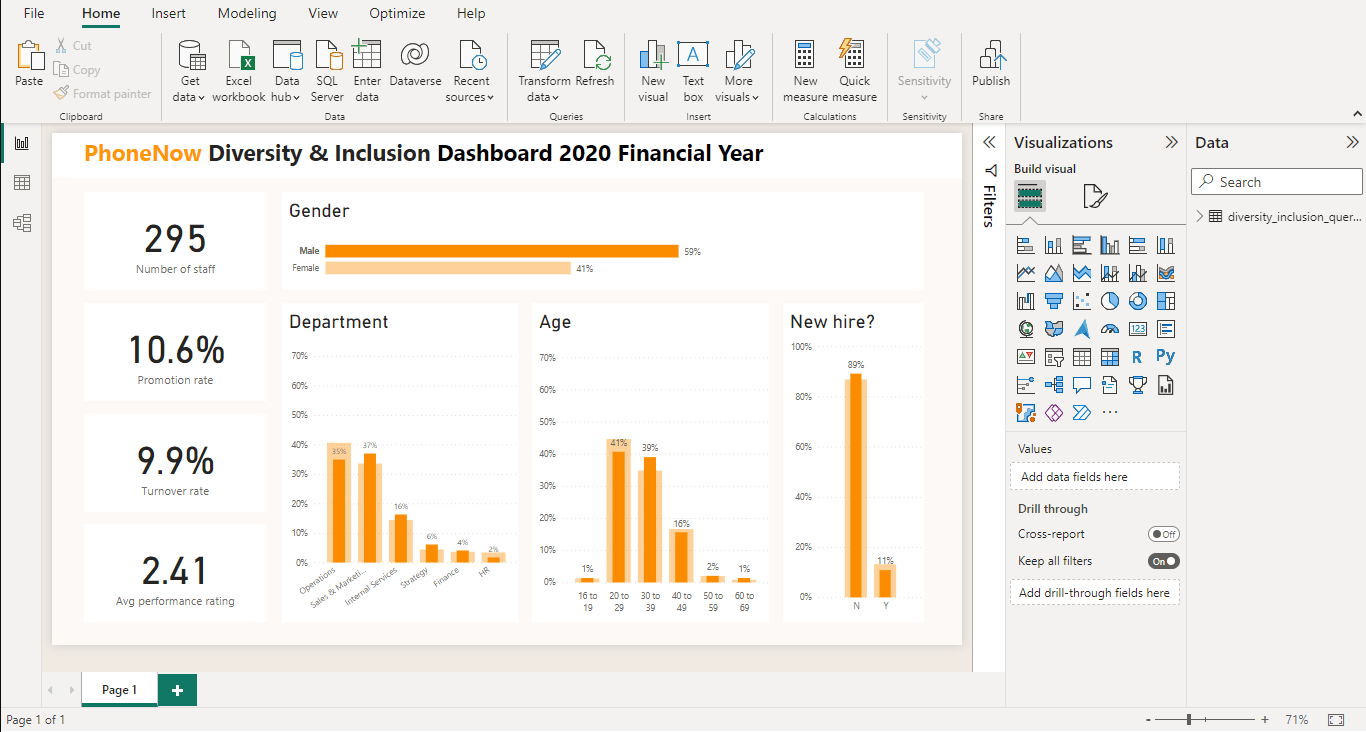
First let's look at males. Males make up 59% of staff within PhoneNow. They have a 10.6% promotion rate and a 9.9% turnover rate.
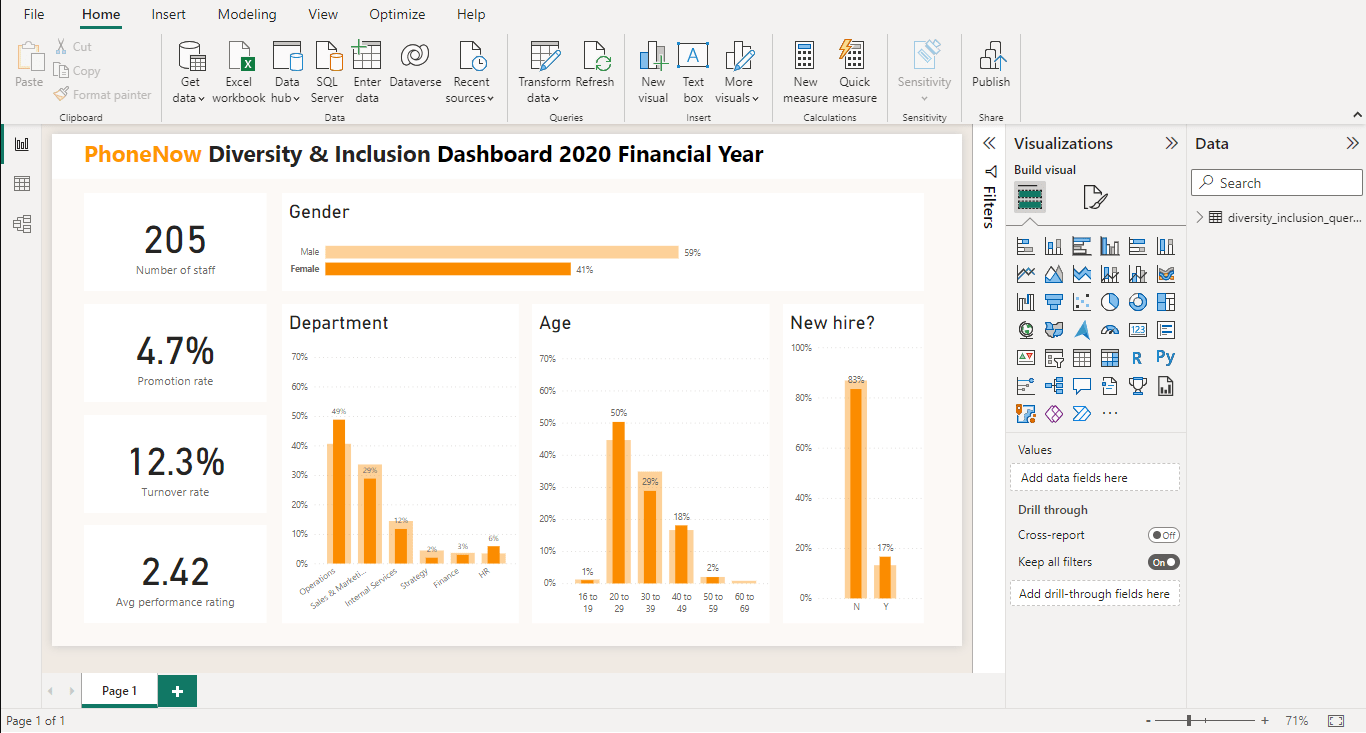
Comparatively, females make up 41% of the staff at PhoneNow. They have a promotion rate of 4.7% and 12.3% turnover.
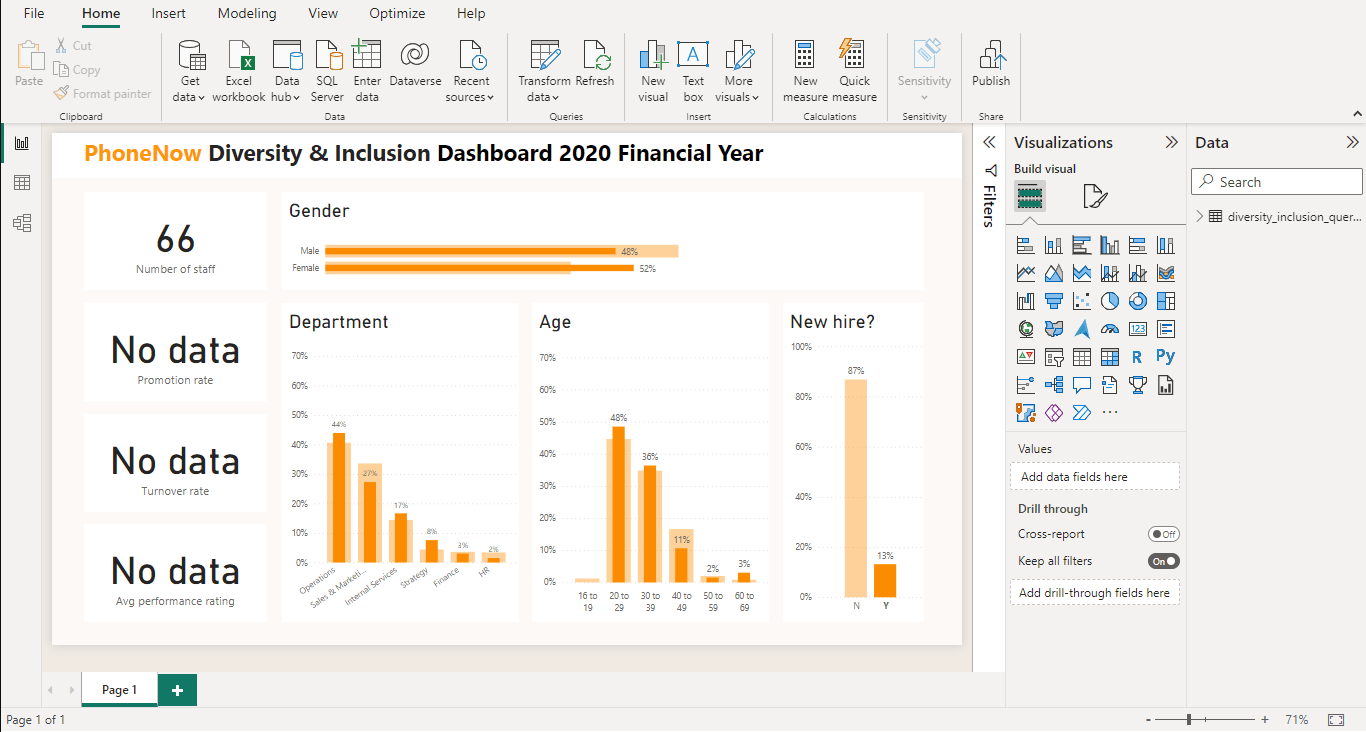
Finally let's check the new hires. In the 2020 financial year new hires at the company have been well balanced gender wise.
So certainly some improvements could be made internally at PhoneNow. While recent hires have been balanced gender wise, more females would need to come in to offset the existing setup. Additionally more females need to be looked for promotions and investigation into why they have a higher turnover could be conducted.
So over the course of the last three business scenarios we have turned PhoneNow's raw data into interactive dashboards and data-driven insights. Different departments now have a way to explore key metrics related to customer and agent behaviour, customer retention and gender balance.
These results were achieved through efficient use of SQL and Power BI to transform and extract data and create visually immersive and interactive dashboards.